Monte Carlo Method in Trading
Building a mathematical model for passing an FTMO One-Step prop account through mass random simulation. Profitability threshold, blow-up probability, and the real number of days.
Listen to article
The goal of this article is to model a mathematical framework for passing prop accounts. I’ll use FTMO One-Step as the base, but this method can run any set of probabilities — the only thing that matters is stating the conditions correctly.
The Monte Carlo Method
It’s solving a problem through mass random simulation instead of deriving a formula. When a process has too many intertwined random steps to compute the probability analytically, we simply run the process thousands of times with random outcomes and count the share of the results we care about. By the law of large numbers, this empirical frequency converges to the true probability.
The classic gambler’s ruin formula only works for the simple symmetric case: a fixed bet, two stationary walls, independent identical steps. In prop trading all of that is broken at once — which is exactly why we use Monte Carlo.
How to apply the method to the model
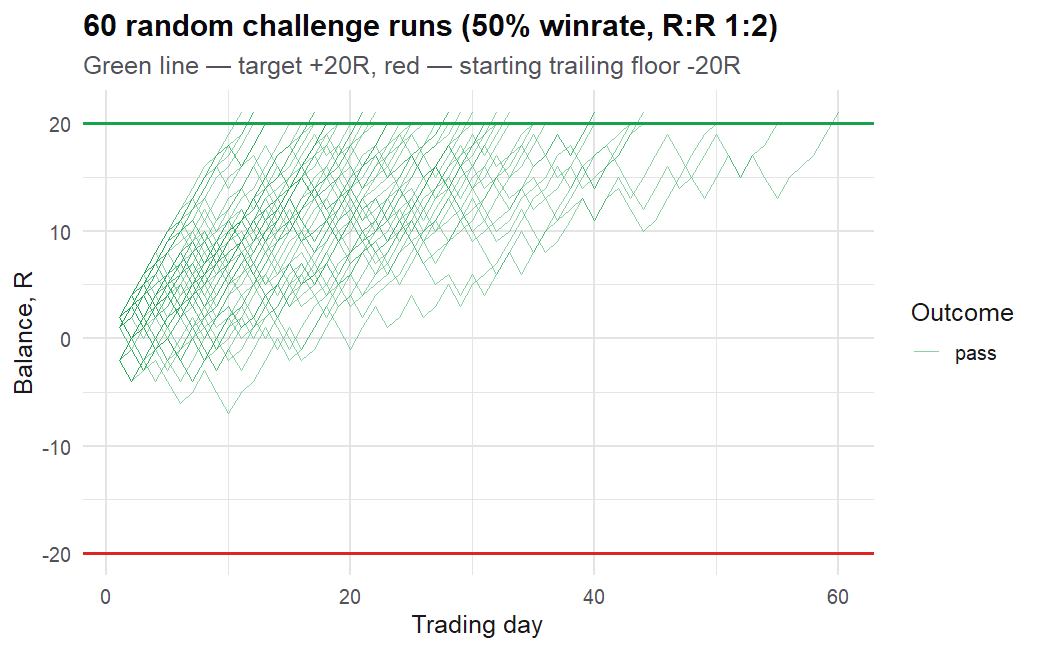
One run is one attempt to pass the challenge from start to finish. Each day we draw random numbers, track the balance, move the trailing floor, and check the walls and the target. Then we record the outcome: pass / bust / timeout and how many days it took.
One thing to keep in mind: with this number of runs the estimated blow-up probability fluctuates noticeably from run to run — the event is rare and there are few examples of it. So it’s enough to remember one thing: a blow-up is a very rare tail outcome, a fraction of a percent.
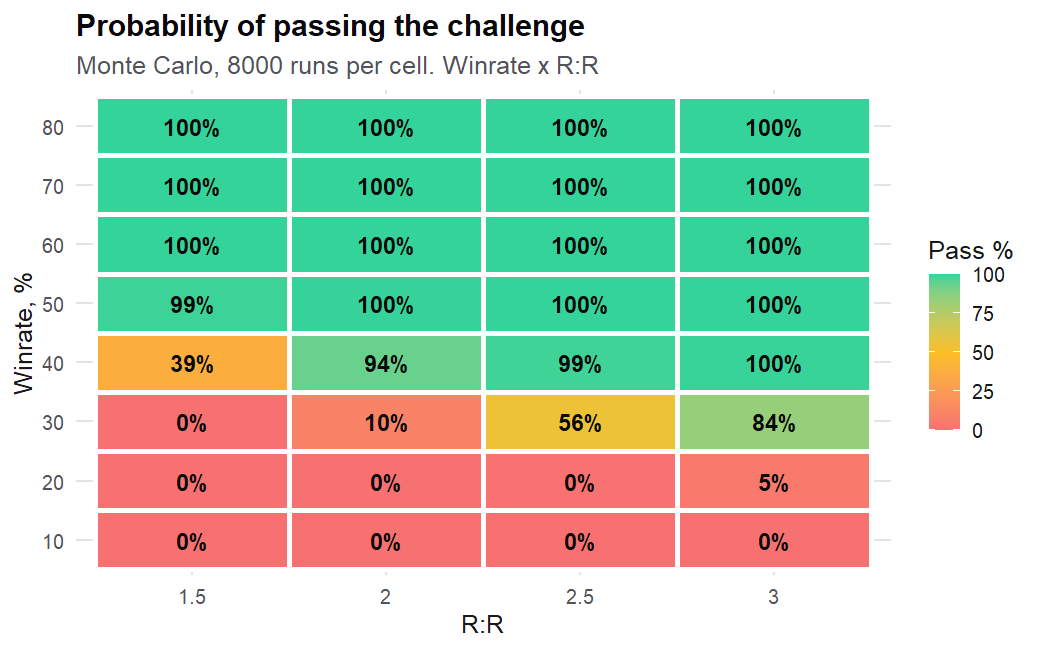
I chose R for the simulation. I wrote a script and got the probability distribution table. Above a certain winrate threshold trading turns positive, and the probability of passing the challenge only grows.
Trading is profitable when winrate > 1 / (1 + R:R):
- R:R 1.5 → need >40%
- R:R 2.0 → >33%
- R:R 2.5 → >29%
- R:R 3.0 → >25%
Only the number of days changes. Everyone can pick which model from here suits them.
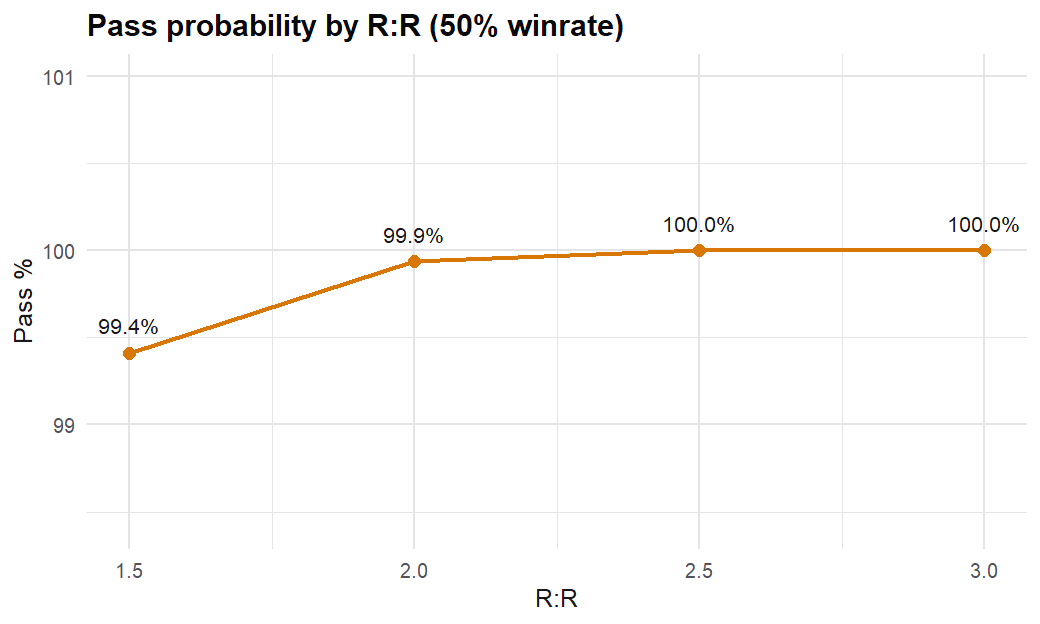
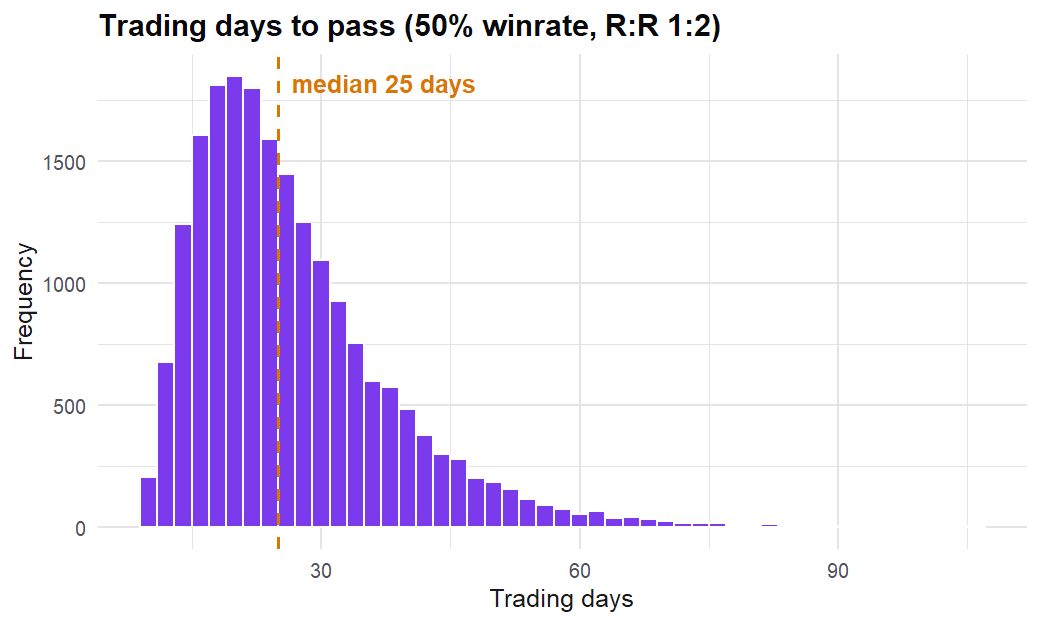
I calculated my minimum worst-case winrate — 50% — and a fixed R:R of 1:2. With these parameters the probability of blowing the account is negligibly small (under 0.05%), provided I respect the chosen limits: 1 take a day, a maximum of 2 stops a day.
But these charts and the model assume an ideal scenario. Once you run all the possible frictions — commission, spread, stop slippage — you get a median of 27 trading days and a 99.92% pass rate.
I’ve picked my model — you can take any of them. I hope this breakdown was useful to someone; it was to me, at least.
In a month or two I’ll write back on how the model performs under real trading conditions.
© Seal